Before joining academia, I thought that writing papers is a kind of side activity that should not take much time and effort. Now I see that I was completely mistaken. Writing a good journal paper is pure art. It requires concentration, inspiration, and, of course, time.
It took me almost 13 months to get my first Q1 journal publication. The draft was complete in four months. Then, the paper was rejected in the Applied Energy journal. I’ve got some controversial comments from reviewers, who did not appreciate the novelty and applicability of my research. Then, I corrected the manuscript and resubmitted it to Energy Economics. The second review process lasted for more than six months. Finally, the manuscript was significantly improved, and the reviewers and the editor were happy to accept it.
I am grateful to my co-authors for their advice and support during the publication process. The paper is now available at: https://www.sciencedirect.com/science/article/pii/S0140988319302798
The results presented in the paper lie at the core of my Ph.D. thesis. The research developed from scratch. It all started with gathering data on Northeast Asia power systems. Together with prof. David Pozo, we launched an optimization model to simulate several cross-border interconnections in the region and estimate the optimal values of power flows. However, similar results have already been obtained for Northeast Asia (for example, by Otsuki et al. https://www.sciencedirect.com/science/article/pii/S0301421515301993) and other case studies.
To go beyond, we decided to apply the Cooperative Game Theory to allocate the savings of cooperation among the countries and estimate their bargaining power. This was the beginning of a new stage of our research. In the next several months, we came up with a bunch of exciting ideas and insights.
Now, it’s time for some illustrations.
Here is the scheme of potential cross-border power interconnections in Northeast Asia that we considered:

And the scheme of optimal transmission capacities and power flow directions that could take place by 2035:
The real fun starts when you have to compose the so-called characteristic function of the cooperative game. It is necessary to consider all possible scenarios of cooperation (coalitions of players). In the case of 6 players (countries), there are 63 coalitions to consider. We visualized the optimized costs for these coalitions in a fancy way:

It is seen that coalition #6, the grand coalition, is the least-cost option for the region. We then allocated the cost savings among the countries using solution concepts such as the Shapley value and the Nucleolus. We estimated the bargaining power of players, analyzed the stability of cooperation, and examined possible ways of arranging money flows and investment schemes.
I don’t feel like duplicating here all the results and illustrations from the paper. Instead, I would rather show some additional materials.
Here are nice pictures of the Core of the cooperative game (the values represent costs in billions of US dollars per year):
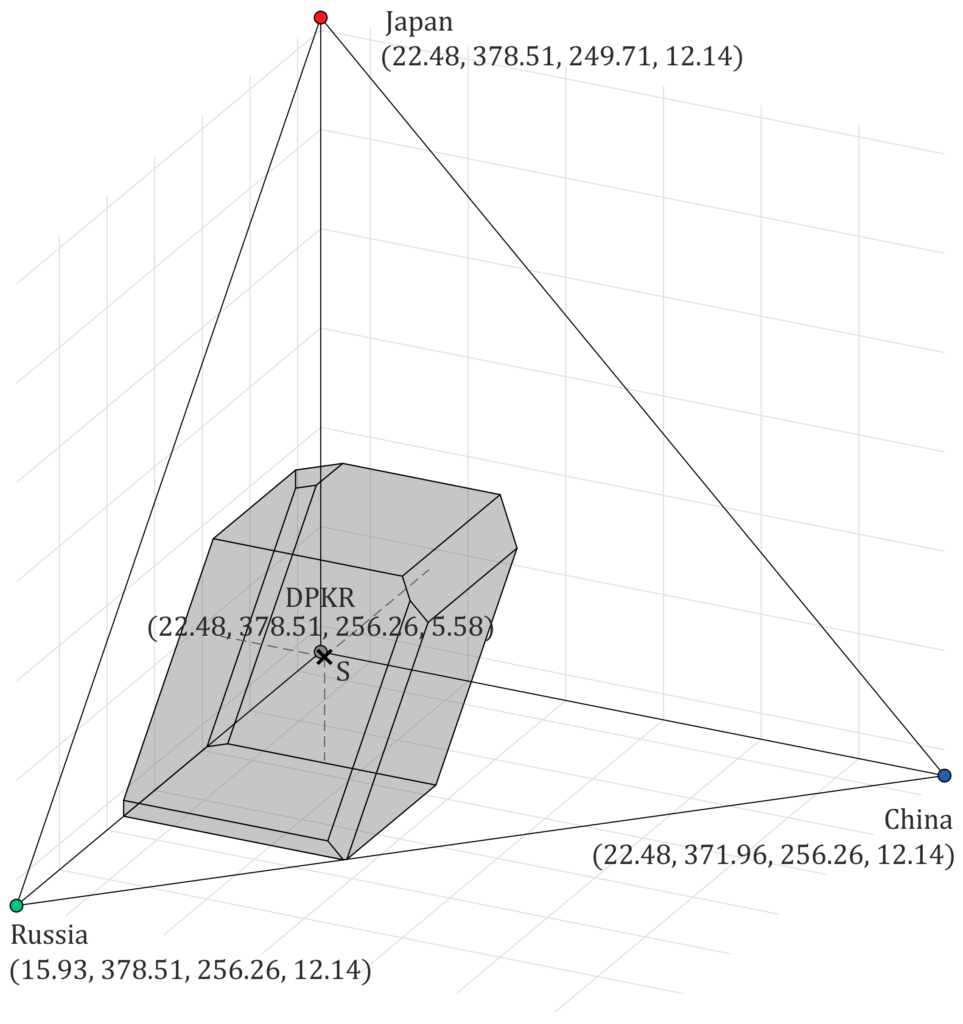
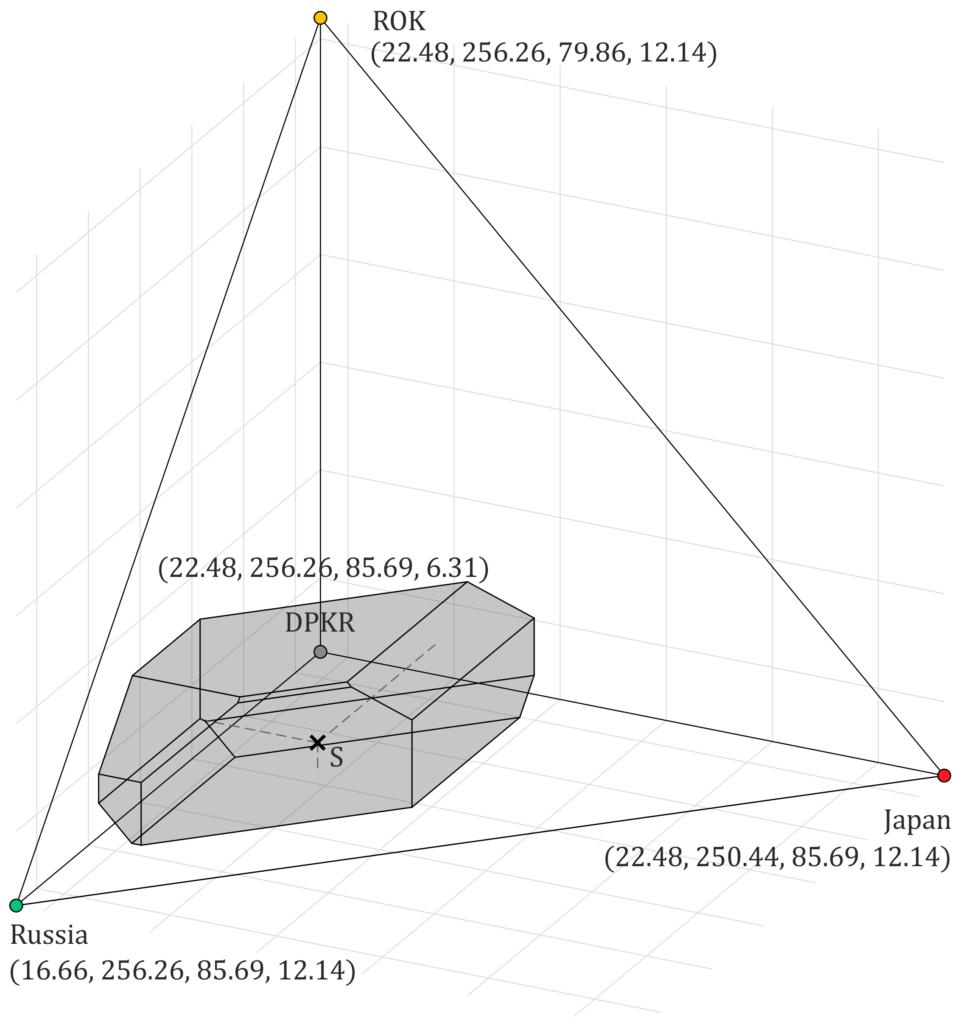
Actually, this is not the Core but its projections onto the Russia-China-Japan-DPRK cooperative game (left) and the Russia-Japan-ROK-DPRK cooperative game (right). The Shapley value was used as the allocation rule here.
These projections tell us something about the stability of cooperation. For example, the cooperative game seems stable for Russia, China, Japan, and DPRK (the left figure). However, the right figure shows that the Core and the Shapley value are rather distant from the ROK. Moreover, the Shapley value is close to the borders of the Core, which signifies possible stability issues. We discuss more details in the thesis and demonstrate that players with lower bargaining power could become underestimated in the grand coalition, which leads to not incentive-compatible solutions and cooperation stability issues.
Another interesting diagram that is absent in the paper shows players’ interdependence. To describe the levels of interdependence, we calculated the maximum surpluses among the players. These values are often referred to as bilateral threats. The point is that one player could threaten another player to leave the grand coalition and join a subcoalition. Both players will be worse if this happens. The question is, by how much? High values of bilateral threats signify that players depend on each other. Low values relate to less influential players.
To visualize all the bilateral threats (30 values for the cooperative game with 6 players), we invented a bilateral values diagram:
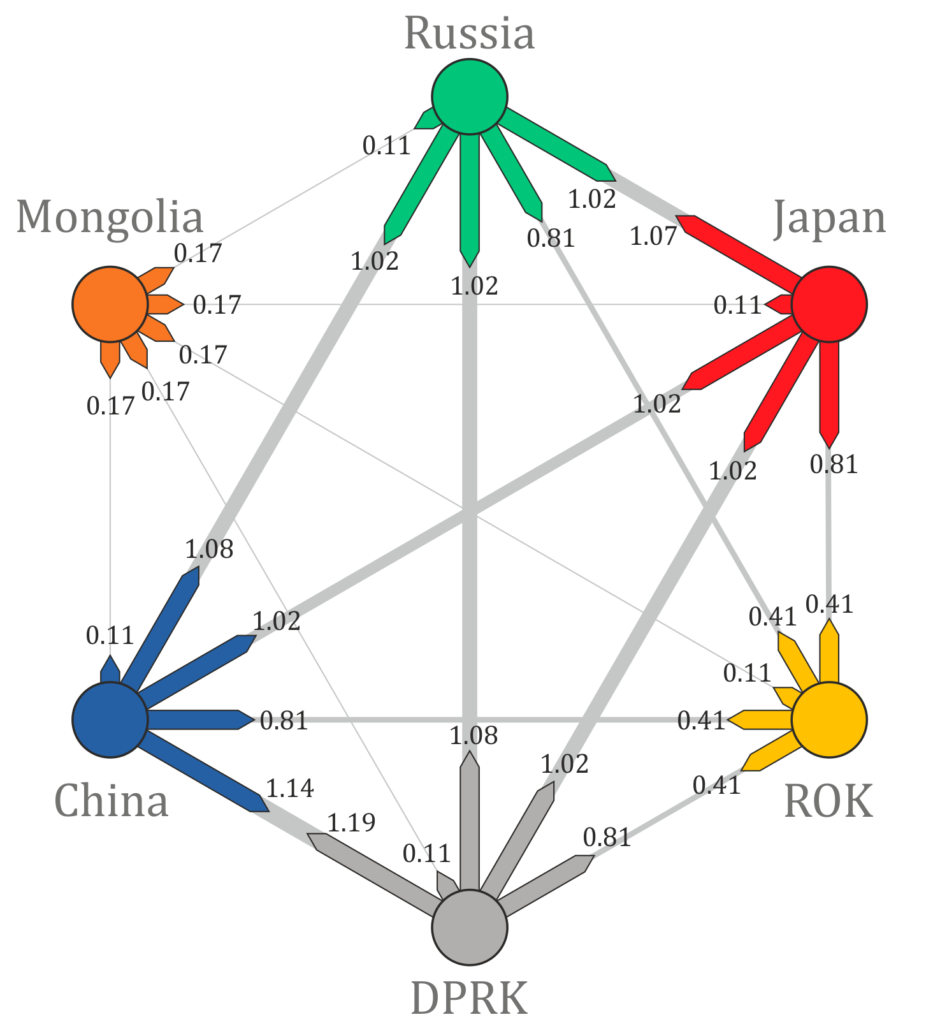
I am really proud of this visualization since it provides a clear insight into players’ positions in the project. More details will follow in the thesis.
Andrey Churkin (Андрей Чуркин) 2019